Matplotlib – Python visualizations
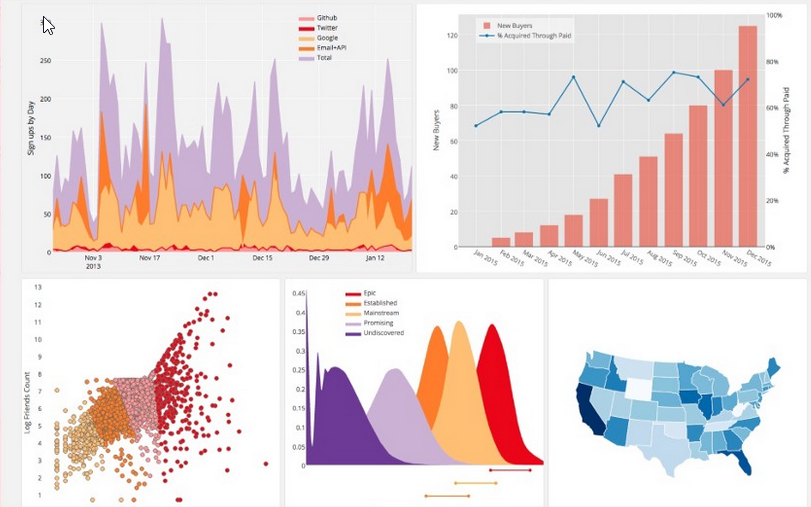
**Matplotlib: the foundation of Python data visualization** When we talk about data visualization in Python, **Matplotlib** is still one of...

Data Science with Python
Ready to start your journey into Data Science? Python has become the go-to language for data professionals—and the best part?...